I’ve been working on a story about religion in this country and I came across a really excellent example of how multimedia can be used well. This is just a short post to share it.
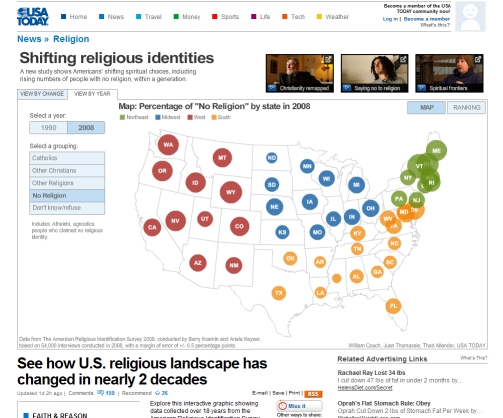
USA Today ran a story about a major survey on religious identification in America. Surveys can be complicated to understand, but when they are shown graphically the numbers can be much less daunting. Making those graphics interactive can even make analyzing the numbers kind of fun. Make the bubbles bigger and smaller here.